Key findings in the year ending September 2019 compared to the year ending September 2018:
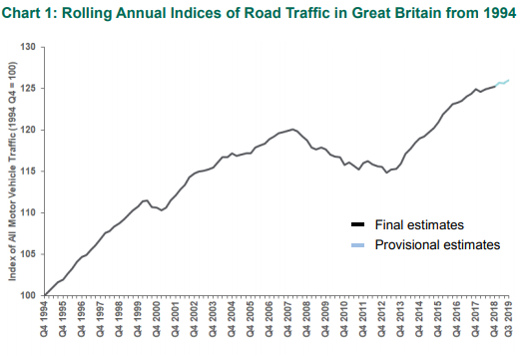
- All motor vehicle traffic increased by 0.8%.
- Car traffic increased by 1.5% to 258.0 billion vehicle miles. Van and lorry traffic decreased by 1.4% and 1.1%, respectively.
- Traffic on motorways and 'A' roads increased by 0.9% and 1.2%, respectively. Traffic on minor roads remained broadly stable (increasing very slightly by 0.2%).
Source: DfT statistical release
Vehicle type
- Car and taxi traffic increased by 1.5% to 258.0 billion vehicle miles (bvm) compared to the year ending September 2018. Car traffic rolling annual estimates were similar with those for the year ending June 2019.
- Van traffic decreased by 1.4% to 50.4 bvm compared to the year ending September 2018. Van traffic rolling annual estimates have been decreasing since reaching a peak of 51.2 bvm last year.
- Lorry traffic decreased by 1.1% to 16.9 bvm compared to the year ending September 2018. However, in the last five years there has been steady growth in lorry traffic (+5.8%).
Road type
- Motorway traffic increased by 0.9% to 68.9 bvm.
- ‘A’ road traffic increased by 1.2% to 150.3 bvm.
- Minor road traffic remained broadly stable (increasing very slightly by 0.2% to 110.2 bvm).
To view the full statistical release click here.
Read a blog post discussing issues raised by increased vehicle traffic.
{{item.AuthorName}} {{item.AuthorName}} says on {{item.DateFormattedString}}: